Linux System Monitoring Basics

Computer system plays a vital role in the operations of any sized companies. From its WiFi routers, printers, laptops, up to the file servers, network equipment, servers, etc. installed either in-house or in a data center. More often than not, people don't usually realize that a business's main functionality is housed in this behind-the-scenes equipment. So, in order for a company to be in continuous operation, it relies heavily on the stability of its own IT network and infrastructure. And that’s where system and network administration come in.
To maintain the stability of the entire infrastructure, systems and network administrator primary goals are to:
- ensure the hardware must be always be working well.
- ensure the uptime of all nodes.
- ensure peak performance of applications residing on those servers.
- ensure that the servers are either sized well and/or able to scale on demand to handle the workload.
- ensure that there are no resource bottlenecks within the entire system.
For these administrators to accomplish their goals, system monitoring plays a pivotal role. It is extremely important and is a key component of any computer system. Monitoring a computer system typically includes installing management software on the device that needs to be monitored and is authenticated to a monitoring server. There is no shared definition of the term ‘system monitoring’ as it varies based on how a system administrator uses it. In its simplest form, system monitoring is defined as a process of continuous scanning, and gathering of different data of different systems over a period of time.
Why System Monitoring?
There are so many reasons why monitoring is needed, it includes but not limited to:
- Access to real-time status of the entire infrastructure.
- Analyzing long-term trends.
- Comparing over time or experiment groups - which is a better storage engine MyISAM or InnoDB for my database?
- Alerting - notification when things exceed our specified thresholds.
- Building dashboards (e.g. graphs, network weather map, etc.) - a visual representation of data (related to 2). It will help see trends that might not be obvious in its raw form.
- Retrospective analysis - correlation between alert received and to the other data gathered at the same period of time.
- Cost reduction - one of the servers deployed in the cloud is underutilized. Either move the app installed inside it to a smaller instance or instead of spawning new instance for a new app, install them on the same server
- Convert gathered data to business analytics.
- Security breaches
- It will help us become proactive rather than being reactive.
RAM Monitoring
In every Linux flavor, it comes with a program called free where it would display the amount of free and used memory in the system at the time of its execution.
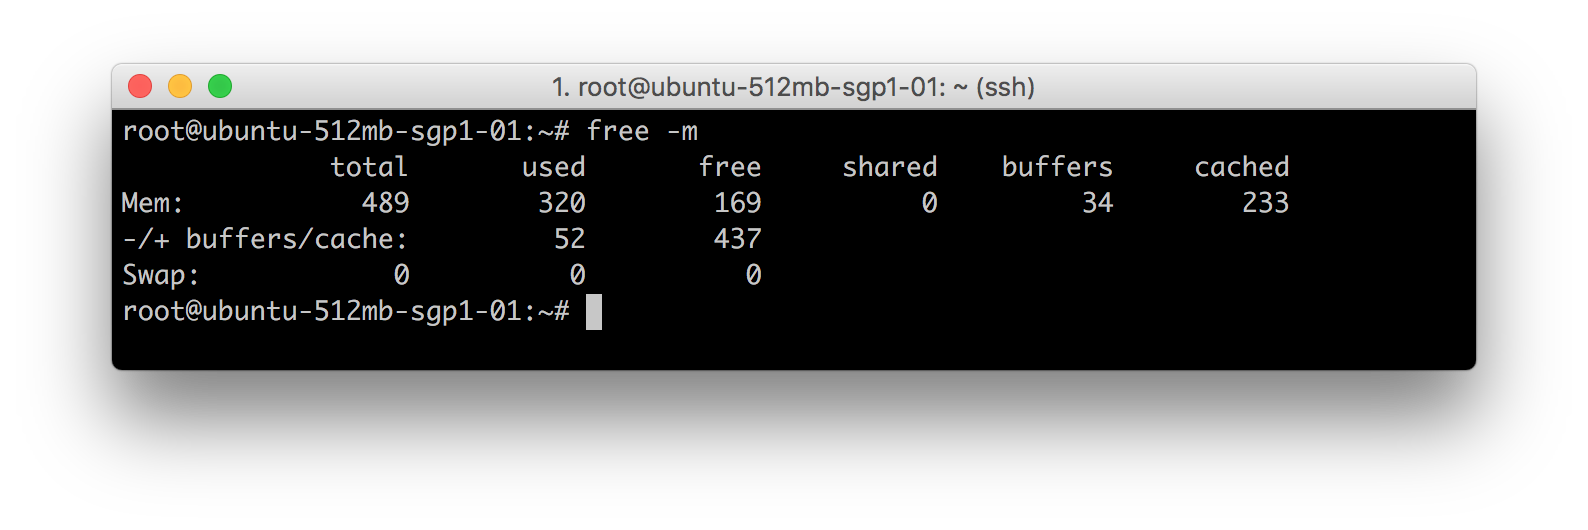
As seen in the image above, free program is used with -m option to display values in megabytes. Here are some of the definition of the items displayed there:
Line 2: Mem: 489 320 169 0 34 233
- 489: Indicates memory/physical RAM available on my machine.
- 320: Indicates memory/physical RAM used by the system. This includes buffers and cached memory as well
- 169: Indicates total memory/physical RAM available for a new process to run.
- 0: Indicates shared memory/physical RAM. This column is obsolete and will be removed in future releases of free
- 34: Indicates total memory/physical RAM buffered by different applications in the system.
- 233: Indicated total memory/physical RAM used for caching of data for future purposes. This memory can be reclaimed/reallocated.
Line 3: -/+ buffers/cache: 52 437
- 52: This is the actual size of used memory/physical RAM used -(buffers + cache)
Mathematical calculation:
- Used RAM: 320
- Used Buffers: -34
- Used Cache: -233
Actual Total used RAM is 320 - (34 + 233) = 53
Line 4: Swap: 0 0 0
This line indicates swap details. In this case, the server doesn’t have a SWAP space available, that’s why it’s returning 0. Installation of SWAP spaces is always optional. Swap is a virtual memory created on HDD to increase RAM size virtually.
CPU Monitoring
Same like with the free command to check memory utilization, there are also different tools to see the CPU utilization (e.g. top, htop, uptime, tload etc.).
Starting with the most comprehensive one, the top program. It basically displays Linux processes. It also provides a dynamic real-time view of a running system. It can display system summary information as well as a list of processes and threads currently being managed by the Linux Kernel.
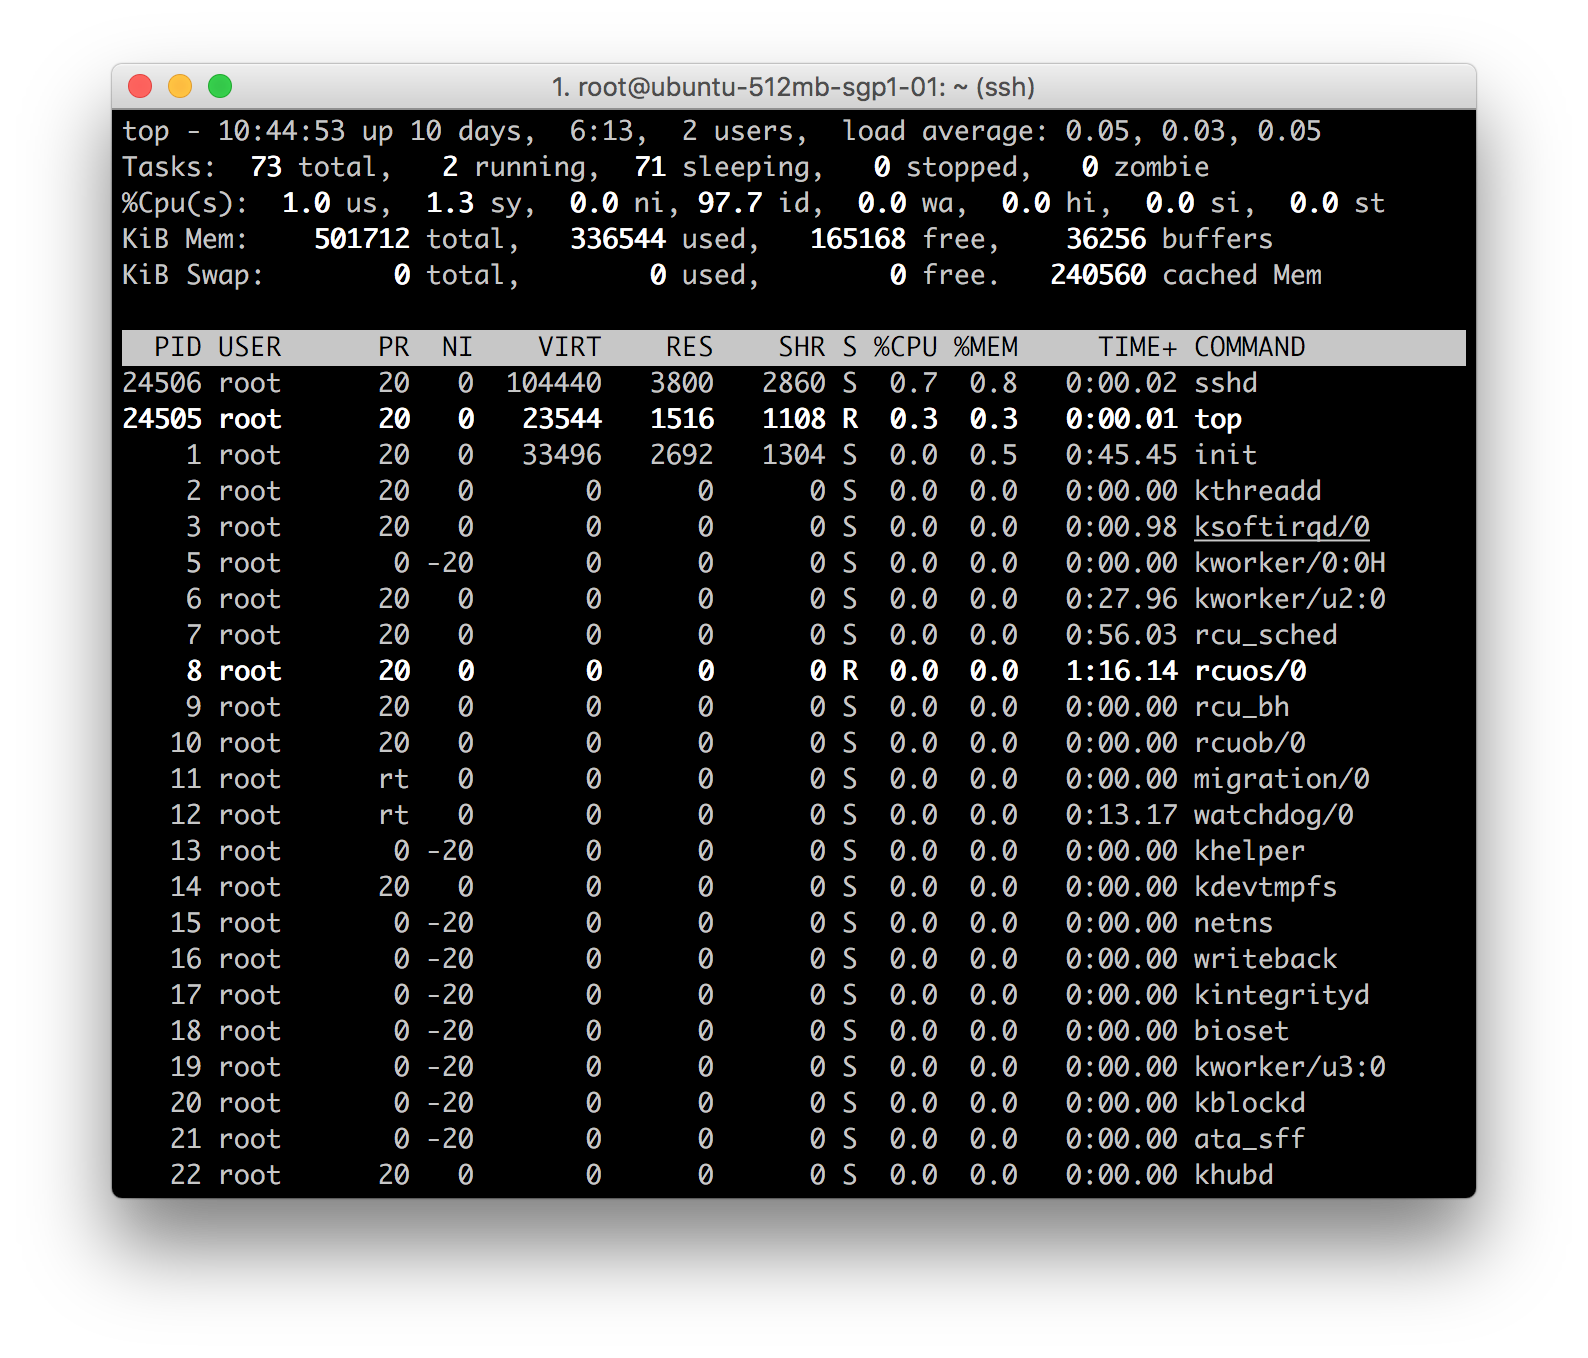
Line 1: top - 10:52:23 up 10 days, 6:20, 2 users, load average: 0.05, 0.03, 0.05
- current time (10:52:23)
- uptime of the machine (up 10 days, 6 hours, 13 minutes)
- users sessions logged in (2 users)
- average load on the system (load average: 0.05, 0.03, 0.05) the 3 values refer to the last minute, five minutes and 15 minutes.
Line 2: Tasks: 71 total, 1 running, 70 sleeping, 0 stopped, 0 zombie
- Processes running in totals (71 total)
- Processes running (1 running)
- Processes sleeping (70 sleeping)
- Processes stopped (0 stopped)
- Processes waiting to be stopped from the parent process (0 zombies)
Line 3: %Cpu(s): 0.3 us, 0.0 sy, 0.0 ni, 99.7 id, 0.0 wa, 0.0 hi, 0.0 si, 0.0 st
This line indicates how the CPU is used. If you sum up all the percentages the total will be 100% of the CPU. Let’s see what these values indicate in order:
- Percentage of the CPU for user processes (0.3% us)
- Percentage of the CPU for system processes (0.0% sy)
- Percentage of the CPU processes with priority upgrade nice (0.0% ni)
- Percentage of the CPU not used (99.7% id)
- Percentage of the CPU processes waiting for I/O operations(0.0% wa)
- Percentage of the CPU serving hardware interrupts (0.0% hi — Hardware IRQ)
- Percentage of the CPU serving software interrupts (0.0% si — Software Interrupts)
- The amount of CPU ‘stolen’ from this virtual machine by the hypervisor for other tasks (such as running another virtual machine) this will be 0 on desktop and server without a virtual machine. (0.0% st — Steal Time)
Line 4 and 5:
KiB Mem: 501712 total, 355316 used, 146396 free, 38412 buffers
KiB Swap: 0 total, 0 used, 0 free. 257832 cached Mem
The fourth and fifth rows respectively indicate the use of physical memory (RAM) and swap (same results with program free).
And as last thing ordered by CPU usage (as default) there are the processes currently in use. These are the different information we can get in different columns:
- PID – l’ ID of the process(1)
- USER – The user that is the owner of the process (root)
- PR – priority of the process (20)
- NI – The “NICE” value of the process (0)
- VIRT – virtual memory used by the process (33496)
- RES – physical memory used from the process (2692)
- SHR – shared memory of the process (1304)
- S – indicates the status of the process: S =sleep R =running Z =zombie (S)
- %CPU – This is the percentage of CPU used by this process (0.0)
- %MEM – This is the percentage of RAM used by the process (0.5)
- TIME+ –This is the total time of activity of this process (0:45:.48)
- COMMAND – And this is the name of the process (init)
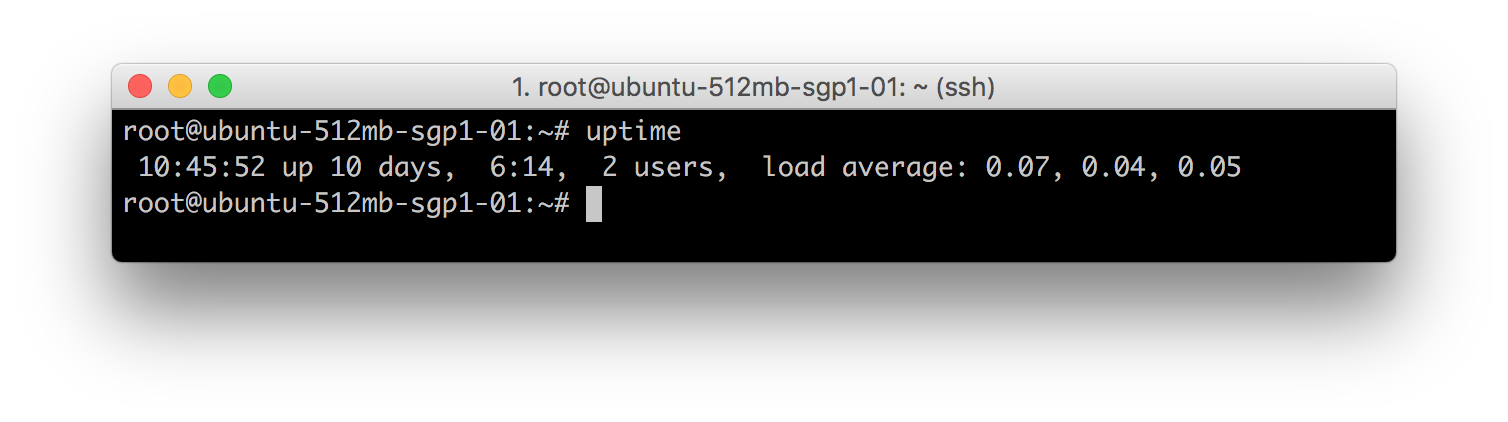
Uptime program. It gives a one line display of the following information. The current time, how long the system has been running, how many users are currently logged on, and the system load averages for the past 1, 5, and 15 minutes.
tload program. It prints a graph of the current system load average to the specified tty (or the tty of the tload process if none is specified).
htop program. It is an interactive process viewer. It is similar with top but allows it is allowed to scroll vertically and horizontally, so all the processes running on the system can be seen, along with their full command lines.
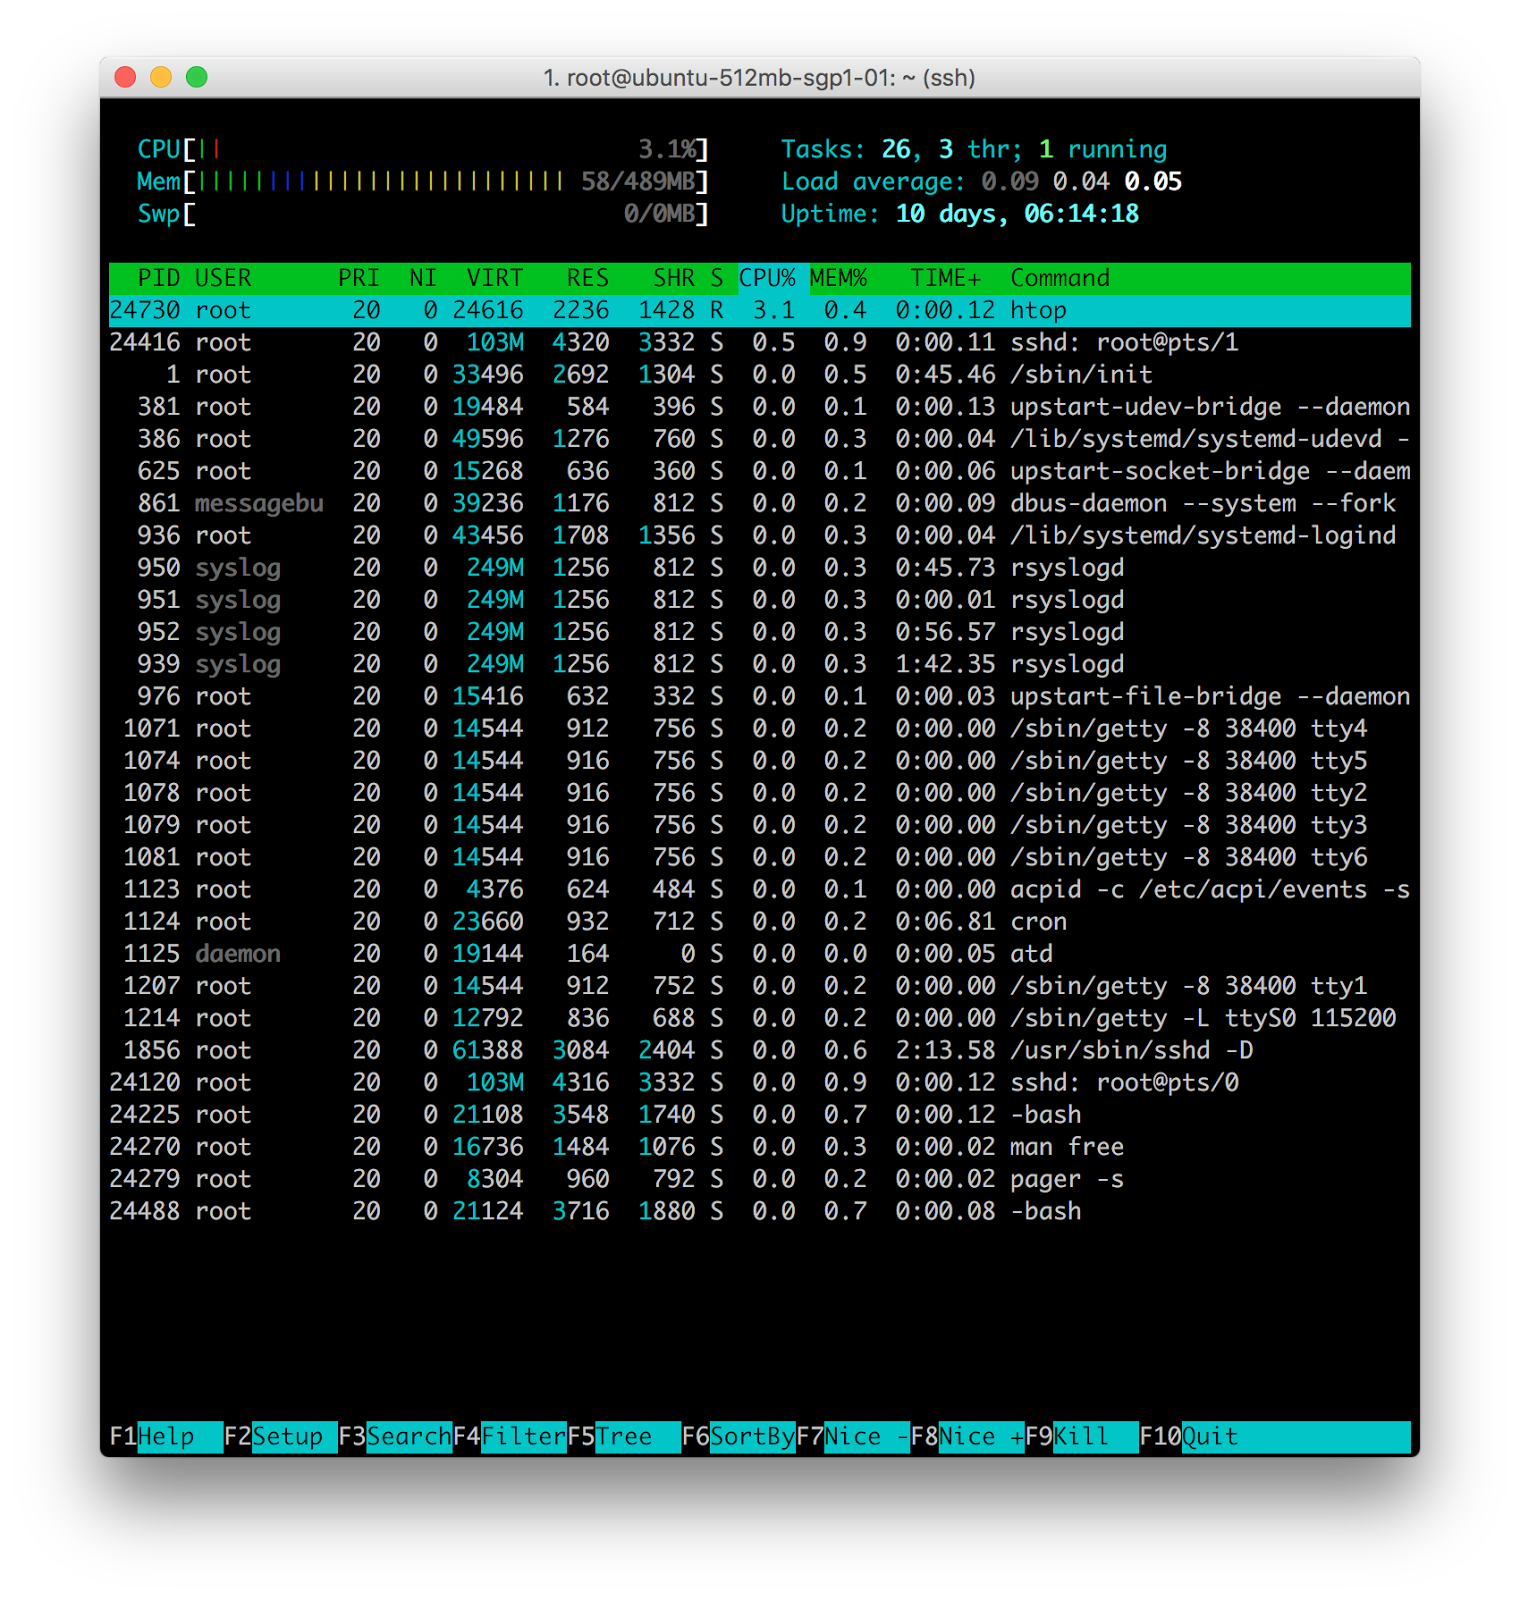
System Load
As seen from the previous tools, it is present in all the 3 programs presented above (values vary only because it was captured at different times) but one thing in common, it is always 3 values. But what do these 3 numbers mean?
Say for example these values: 0.07 0.04 0.05, it is read as:
- Load average over the last 1 minute: 0.07
- Load average over the last 5 minutes: 0.04
- Load average over the last 15 minutes: 0.04
Load Average is the average number of processes which are running or waiting to be executed per minute, five and fifteen minutes. These values do not depend on the number of processor cores, but the more cores you have, the more processes can be run simultaneously. So, for example, when Load Average is 3 on a one-core machine - it is overloaded, while on a quad-core machine it is a normal working load.
Disk Monitoring
Normally, when disk performance is being discussed, there are always two things being monitored, IOPS and disk space. Disk space is just how much of the disk space is being utilized while IOPS is the standard unit of measurement for I/O (Input/Output) operations per second. In a layman's term, IOPS is just the read/write performance of the disk. There are also built-in tools in Linux flavored machines that monitors these:
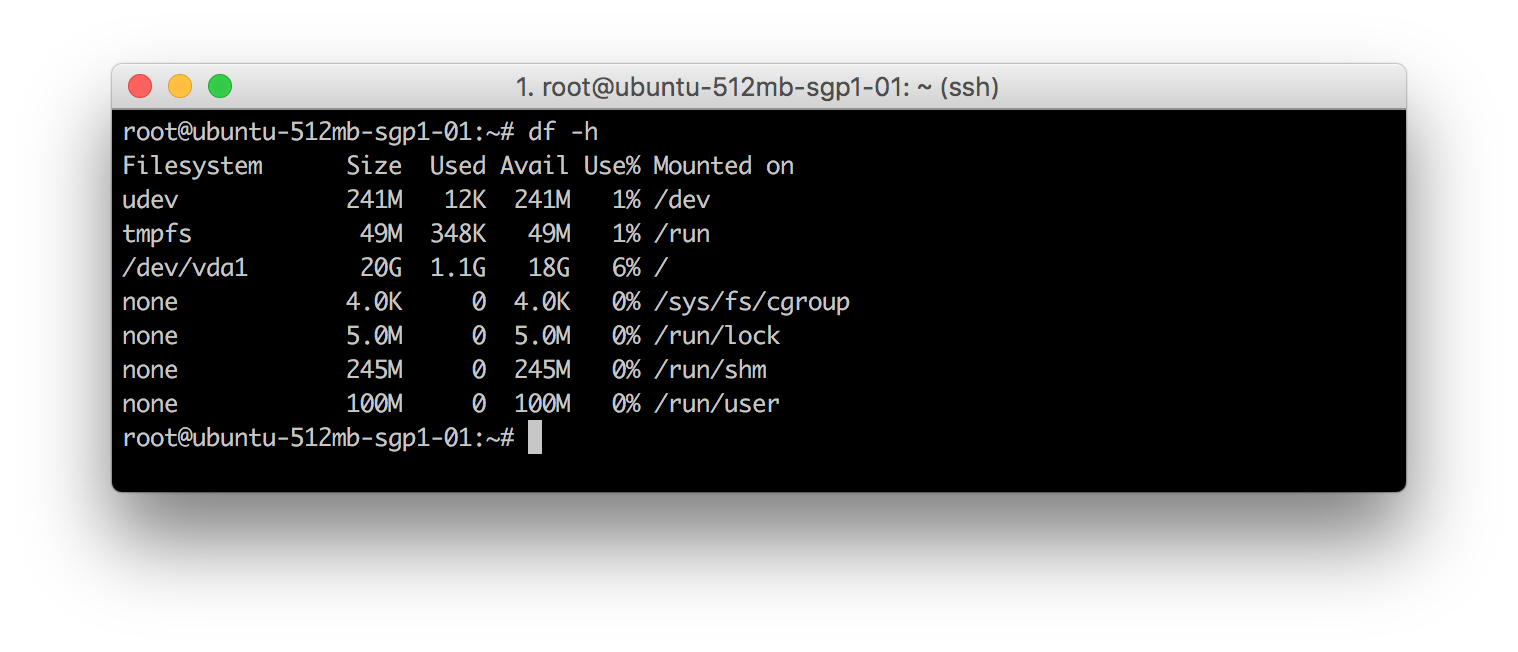
df program. It reports file system disk space usage.
The program df is used with -h option to make the values human readable. Column names are basically self-explanatory. Filesystem is the partition created while Mounted On is the mount point the partition is accessible.
iotop program. This is a simple top-like I/O monitor.
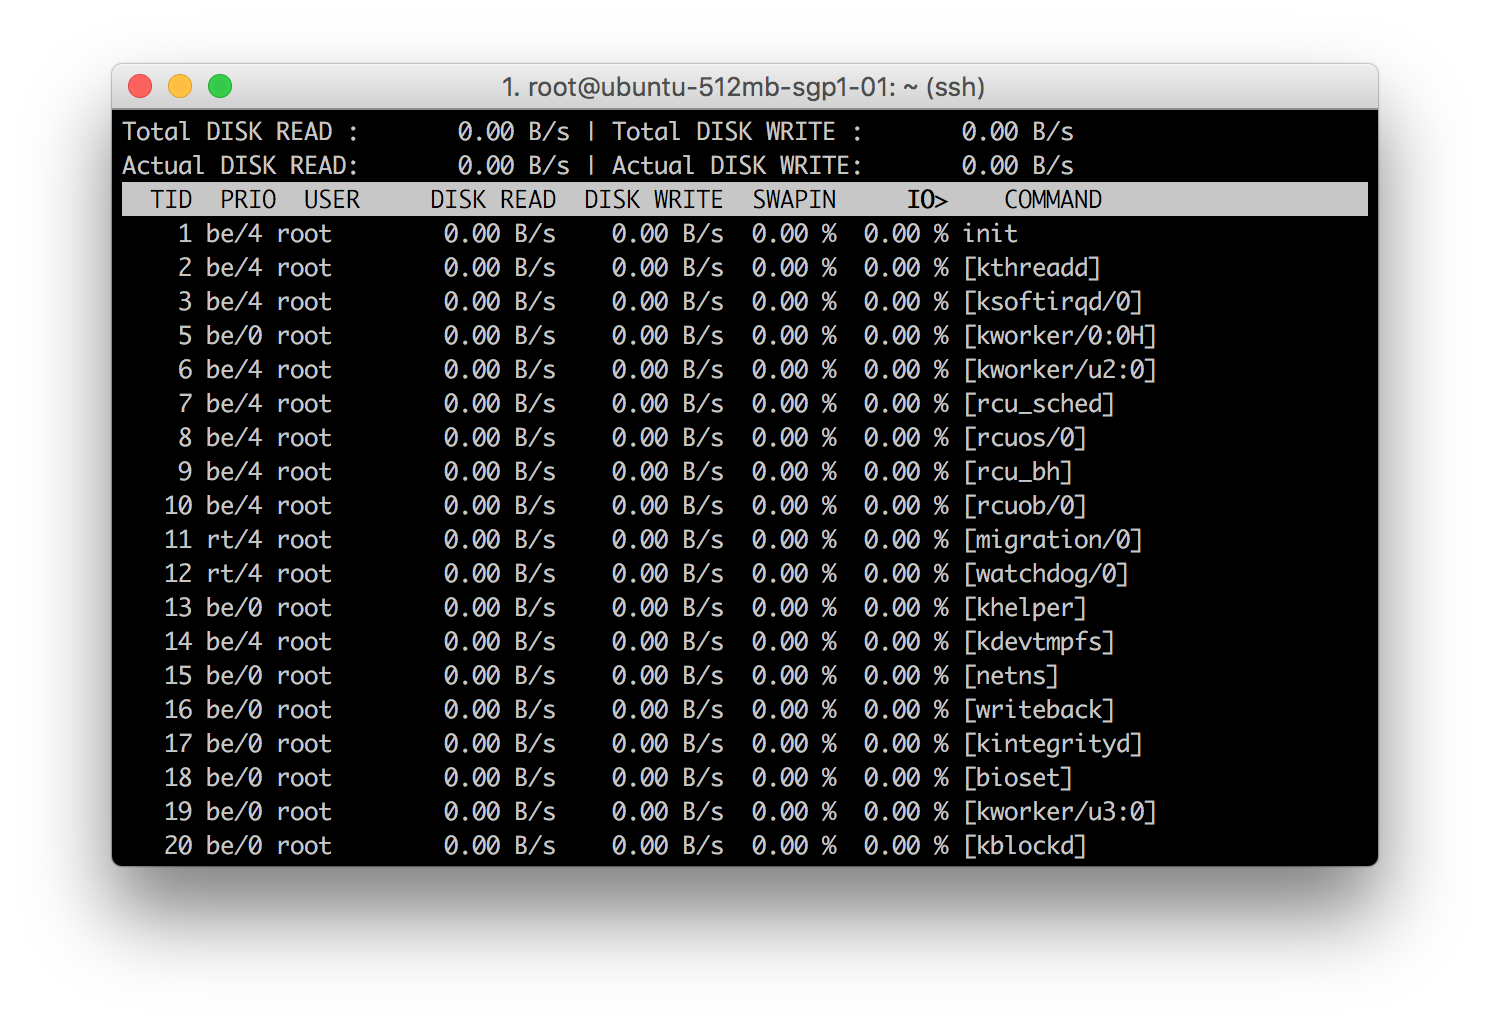
iotop displays columns for the I/O bandwidth read and written by each process/thread during the sampling period. It also displays the percentage of time the thread/process spent while swapping in and while waiting on I/O.
As illustrated above, monitoring can be implemented very easily. In Linux, aside from the fact, the data are already present, it also comes with free programs and tools to monitor it. It’s only up to the system administrator to implement it in such a way that it would be easier and be more human readable to a non-technical person.
Monitoring really does come with a lot of benefits. Namely:
- It enables data-driven insight and decisions.
- Detect problems early to prevent disasters.
- Improve productivity and performance.
- Plan and budget for IT upgrades.
- Prevent and reduce downtime that could result in business losses.
Monitoring a computer system is just as important as the system itself. It’s also as important as testing the applications deployed in the system. Implementation is also just a start of a better health computer system. As the infrastructure grows, different strategies can be implemented, tuning and continuous improvement is always needed.
Most of the time, monitoring all systems and setting up a thorough and finely tuned alert coverage requires effort and time. But with the right tools and proper understanding of the entire infrastructure, and application stack of a system, a manual approach that covers problems before, during and after an incident occurs, system monitoring can at least lessen these frequently occurring problems and maybe teach a system how to react the next time it happens.
Reference:
- Linux Manual Pages: https://linux.die.net/man/


